Modelling of district heating – mighty difficult or minimally so?

© Vino Li
What is a model? In the simplest terms, it is anything that represents something else. In the context of district heating (DH), modelling is important for two reasons:
- To look at the current situation (i.e., existing infrastructure, heat demand and supply density, available resources, etc.) and to plan the potential expansion of the network.
- Since DH usually presents large and long-term investments, cost modelling of said expansion can easily be said to be one of the major criteria when it comes to evaluating its possibility and, therefore, deserves its own examination.
To get a better idea of these two aspects of modelling, we invited Dr. Urban Persson (Halmstad University), Dr. Alice Denarié (Politecnico Milano) and Per Alex Sørensen (PlanEnergi) to paint us a clearer picture of the current praxis in the field.
The benefits of simplifying heat planning
With plans of the European Commission to implement mandatory heat planning for cities above 50,000 inhabitants as part of the Energy Efficiency Directive (see more here), heat planning is en route to becoming even more important for local governments.
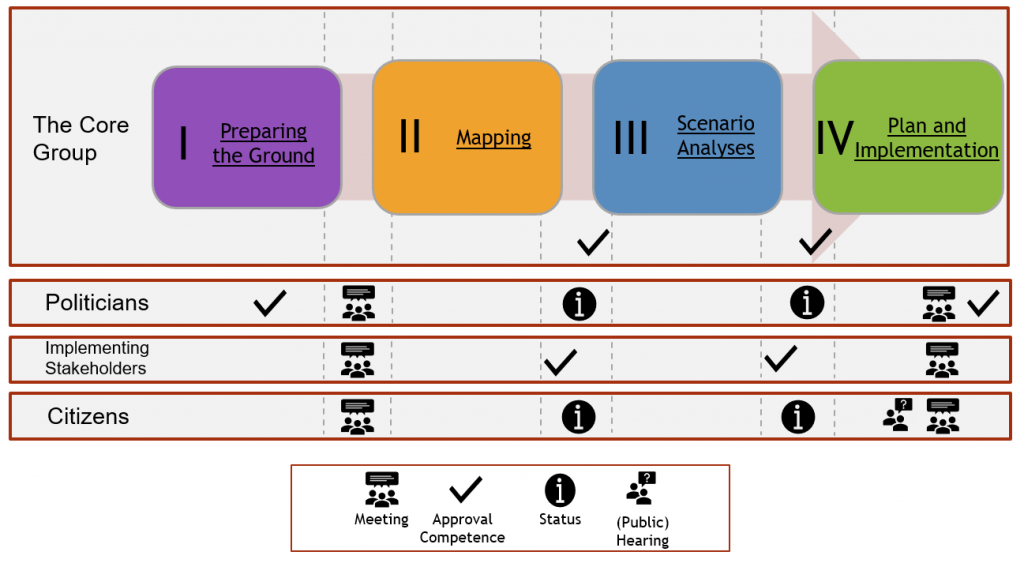
The German region of Baden Württemberg is already going one step further, making heat planning mandatory for cities above 20,000 inhabitants. To facilitate the work of planners, the region has asked PlanEnergi & the Danish Board of District Heating to develop a toolbox, gathering guidelines and tips which can be adapted to various local situations. Per Alex Sørensen took part in the development of this tool and gave Decarb City Pipes 2050’s consortium an overview of its potential.
There are four main phases in the planning process of this toolbox, which can be seen below:

Each phase is further divided into several sub-steps including a list of the different stakeholders to be involved and the approval competences needed at the different stages. Best practices are also featured for each step, to give inspiration to the planners. Those examples are at the moment solely Danish, but the aim of the tool is to be personalised, thus slowly replacing the Danish examples with German cities (or from other countries, wherever the tool is to be used).
This aim of this toolbox is to be a living document, gathering several experiences. It is an example of bottom-up approach which highlights once again how crucial the access to data is, to make the tool as accurate as possible.
The tool will be in a testing phase until the end of January 2022 in Baden Württemberg, before being potentially extended to other regions.
Cost modelling
When comparing the economic sustainability of individual solutions to district heating, cost modelling is invaluable, and, indeed, is the one way to determine whether DH is the solution for an area.
Calculating the costs for individual systems is fairly easy: it is the sum of capital expenses upfront and operational expenses per a time period. For DH, however, the equation is a bit more complicated. A simple scheme illustrating this can be found below.

In this case, there are three main cost-efficiency drivers: a lower temperature system, the zoning, and high connection rates. The heat distribution is mostly where the devil lies, as this is the key additional cost component in comparison with local heat generation, and thus the one to be examined closely. The main factors affecting it are heat demand density – installing pipes is costly and would not make sense in the countryside – and the specific investment costs. Therefore, heat demand mapping with a spatial component (i.e., population density) of a high resolution is of the utmost importance and will determine the feasibility of DH and, thus, indirectly also large-scale heat recovery projects. Access to data is once again a key factor in cost modelling.
The City of Milan has confronted itself to the exercise, with the aim of making a transition from fossil building-scale heating system to renewable solution at district scale. Politecnico Milano, in charge of the project, has calculated the potential diffusion of DH in the area, comparing costs of individual systems vs. district heating. It is a big challenge to estimate the cost of something which does not exist yet. To be as close as possible to reality, Politecnico Milano collected as much data as possible on the potential heat sources, compared the different heat taxes between the surrounding cities and set up a stakeholder group to estimate the cost of those potential developments.
The next step was the conversion of the heat map into a heat distribution map, looking for the best methodology to find the minimum cost delivery heat while matching heat demand and heat sources. This minimisation was the base of the modelling, which can be summarised in five steps:
- Mapping the heat demand
- Mapping the potential connection to the district heating system
- Mapping the mostly dense heat demand
- Having an overlap map of heat sources
- Analysing the results
Thanks to this, the City of Milan found out that out of the 11TWh of demand, 70% was connectable to the DH system, but only 22% could be economically delivered by it, since subsidy schemes are still mostly for gas.
Key takeaways
During this session, consortium members were presented good examples of cost modelling applications and an example of a comprehensive toolbox for modelling. One of the most underlined elements by both speakers and participants is that cost is heat demand density dependent. This session was also the opportunity to discuss different methodologies of modelling when data is not available, and to highlight once again how crucial access to the latter is.
