
The data-driven future of heat planning

© Jason Dent
Energy modelling is key for cities to get a good understanding of their energy demand and greenhouse gas emissions. Urban and energy planning decisions should be data-driven. But how can cities have access to good data on their building stock?
3 dimensions to consider in energy modelling
When working on their heating and cooling planning, there are three key dimensions cities have to consider: the demand, the infrastructures and the supply side. With the Decarb City Pipes 2050 project, our objective is for cities to decarbonise and find innovative heating and cooling solutions for their districts. It is therefore important to act on these three aspects, both in the long and in the short run. The demand side is the one that is more resistant to change. As most buildings are privately owned, cities face more difficulties to reduce the energy demand. In this article, we’re taking stock of possible ways to obtain a spatial analysis for the demand side.
Energy modelling: a combination of top-down and bottom-up approaches
There are two main ways of mapping the building stock’s energy consumption: the first one, a top-down approach, consists of collecting available aggregated real-consumption energy data, which are then split at district or building levels based on different parameters (e‧g. building ages, building fabric, surface and height, heating systems…). This is often preferred when the data available is either not sufficient or at low granularity to estimate their individual consumptions. Another bottom-up approach consists of collecting the consumption of individual buildings or modelling them. In fact, energy modelling of buildings’ consumption is often a combination of the two methods, depending on the type of data available, which can vary for the different energy carriers. This can also allow one method to help verify the accuracy of the other.
National legislations should enable access to data for cities
All too often, cities are dependent on the willingness of utility companies to share their real-consumption data at a good granularity (via non-disclosure agreement), unless the national legislation favours open data approaches. In the Netherlands for example, the legislation forces all the energy utility companies to publish the effective consumption of small clusters of buildings, which are usually composed of 15-20 delivery points. This measure facilitates urban planning at district level by cities. The question of open access to data is also key regarding the energy supply side, especially for the renewable energy potential. The Dutch legislation also allows cities to have access to a lot of data to estimate their geothermal energy potential by binding oil and gas companies to publish the data from their exploratory studies of the underground.
Building archetypes and Building Energy Ratings as a basis for energy modelling in Dublin
Codema, Dublin’s Energy Agency, aspires to a model based on public data and open-source development. Dublin’s model employs specially-requested Small Area (80-120 dwellings) Building Energy Ratings (widely known in Europe as EPC) data for known buildings and data-driven archetypes for unknown buildings. The archetypes are developed by taking average building properties for each period of construction in each Small Area. In other words, unknown apartments built between 1970 and 1980 in an area of 80-120 dwellings are assumed to be equivalent to an archetypal, composite apartment whose properties are equal to the average of all apartments of that period in that area. Average is defined as the median for all numeric columns and the mode for all category columns (i. e. brick, stone walls etc). As the replication of this methodology is somewhat onerous, we have built a web application to generate it automatically for any region in Ireland here. This stock is being used as an input to a simple Resistance Capacitance building model (based on ISO 13790) to model retrofit scenarios. Manipulation of these scenarios will be possible via a web-based application which is being developed by the Codema team.
Commercial and industrial buildings are somewhat blind spots for the modelling as, unlike residential, only floor area information is available. As a result, floor area energy benchmarks are being used to estimate demand which is comparatively crude. Nonetheless, for the gas consumption, Dublin’s archetypal approach is close to the real-consumption data disclosed by the gas distributor at district level, meaning that the methodology used is robust and a fair approximation of the reality.
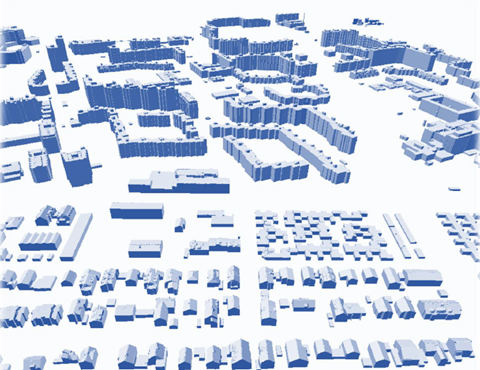
Munich develops a 3D model of the city aggregating more than 100 data sources
To go beyond an archetypal approach, Codema would need better data on commercial buildings’ geometry and fabric, which is currently not publicly available. From the point of view of building geometries, the OSM Ireland Buildings project is showing some promise in crowd-sourcing the mapping of building footprints. Reassuringly, the organisers of this project also verify the user-inputted footprints before deploying them to OSM. By making some assumptions about unknown building heights OSM Buildings creates a 3D web map of Dublin, however, it is missing fabric information and will be for some time without some investment in surveying.
Overcoming this data gap with assumptions, the REDAP project has opted to fill the commercial building stock with the most typical residential building properties in the immediate proximity of the commercial building.
Not content with this data gap, the Munich planners surveyed their stock to estimate periods of construction for each building, and further invested in the acquisition of a 3D city model via laser screening to know the exact volume of each building. The resulting map has been enriched with more than 100 data sources to provide a comprehensive picture of the building stock[1] by enabling estimation of each building’s energy consumption (except for those owned by the city for which real-consumption data is available). It is also regularly updated with information about demolition of buildings, creation of new ones, and renewable energy production plants.
Energy modelling: a rising need for cities
The granularity of the modelling depends on the needs and data available: for overall city and district planning, aggregated estimation at the hectare level can be sufficient; on the contrary, data at building level is necessary to carry out concrete projects (such as district heating development). In any case, energy modelling is increasingly important for cities to get a deeper knowledge of energy demand, GHG emissions and their action plans’ impact. These models should support data-driven decisions and the integration of urban and energy planning altogether, encompassing socio-economic aspects as well (such as energy poverty). In addition, data platforms are key tools to engage stakeholders and widely share knowledge to foster the heating and cooling transition. Dublin and Munich address the matter respectively with Dublin Energy Webmaps and Munchen Energie Portal.
[1] These data sources include buildings’ years of construction, city-owned buildings, underground data, companies’ location, etc.