
Spatial heat planning: a backbone for buildings’ transition in our cities

© Sigmund
Heating and cooling plans aim at providing guidance to citizens, local businesses and stakeholders on the cost-effective solutions to switch from fossil-fuel boilers to low-carbon and renewable heating systems. They are a key piece to guide the actions and provide the direction for urban and energy planning. Because energy consumption, renewable and waste heat sources are different district-by-district, solutions should be analysed area per area thanks to spatialised data.
Making heat plans: a number of parameters to consider
Rita Gnehm, an experienced energy and urban planner at PLANAR AG für Raumentwicklung, supports the heat planning of the city of Winterthur among others. She published the Guide for cities developing heating and cooling plans, explaining procedures and parameters to take into account.
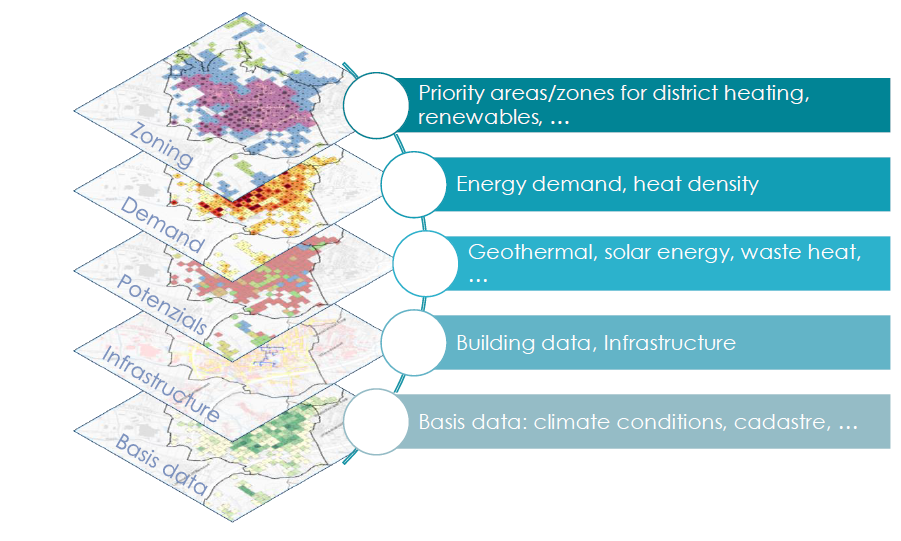
Three main maps are necessary before drawing a heat plan:
- The infrastructure map, showing heat networks and other energy infrastructures
- The heat density map, displaying existing and future heat demand of buildings
- Potential maps, providing the potential of energy supply from renewable and waste heat.
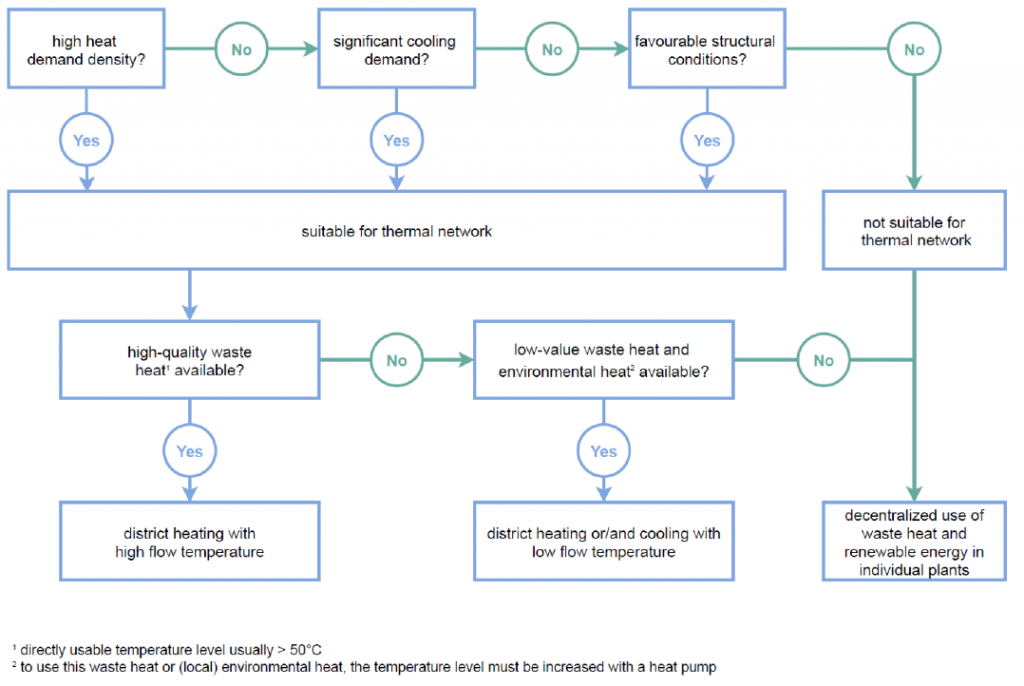
Based on the spatial distribution of these data, it is possible to define which heating solutions are the most cost-effective for each city district.
Quality of the outputs is highly dependent on the quality and availability of the data. To support cities, the above-mentioned guide proposes solutions for 3 different cases:
- Hardly any data is available, a complete estimation is necessary
- Partial consumption data and/or combustion data is available
- A digital twin is available (each building is mapped, if possible, with measured data)
Future heat demand density is derived from current heat demand, based on the building’s age (construction period), the retrofitting rate and retrofitting depth. It is key to consider a rebound factor when choosing the retrofitting success rate since theoretical savings are almost never realised. In a Dutch study, a rebound factor of 25 or 30% was determined (depending on whether the building was owned or rented). Renovation rates also need to be speed up: in Switzerland, the energy-related renovation rate is currently 1% per year, but the national climate strategy aims at an annual retrofitting rate of 1.2% until 2040.
Heat demand density allows to estimate the potential of district heating development based on economic factors. Experience has shown that the limit density for an economic operation of district heating in urban Western Europe is between 300 – 500 MWh/ha/year. But it clearly depends on the types of district heating networks, on the types, prices and location of energy sources available, and on structural framework conditions (such as ownership structure and types of buildings, or typographical conditions).
Heat plans need continuous improvement to include latest developments
A first heating and cooling map doesn’t need to plan all details. Further feasibility studies and pilot projects will help to sharpen data and adjust hypotheses for the next version. The City of Rotterdam is the perfect example that heat planning is an iterative process.
The first What-map, presenting the most cost-effective solutions to replace fossil gas boilers, was setup in 2018. In 2021, the city developed a more accurate version, presented by Lydia Hameeteman. This one is still based on the same methodology taking into account costs of investment for building insulation, of connection to networks and their expansion and reinforcement, of energies. However, it includes more detailed data regarding energy consumption, types of buildings, and costs based on on-going projects and new studies.
This is key for the city to show that Rotterdam always strives for the most accessible and affordable systems for citizens. The heat map provides transparent information to citizens about what would be possible in their neighbourhoods. Of course, local factors at building-level can always play a role in the eventual outcome, thus the map is a guide, not the answer.
Stronger together in Rotterdam – The Hague: heat planning at regional level
The same steps have been applied by the Region of Rotterdam – The Hague when defining its heat plan: analysis of heat demand, heat supply and heat infrastructure, without forgetting the conditions to implement the plans.
One of the main results of the Regional Energy Strategy 1.0 regarding heat is that cities of the Region will do better together: the development of heat networks for several cities will reduce the costs by 25% compared to the scenario in which each city develop its own heating district network. The collective option also allows to cover more heat demand via district heating (from 67% to 80%).
However, techno-economic elements are not good enough: the right framework conditions are needed. According to Astrid Madsen, energy independent expert who supports the Region, the heat transition can be successfully designed if all parties are willing to participate. This can only be achieved by designing a supported approach for and by the parties throughout the value-chain of the transition, whereby:
- public interests are safeguarded
- there is sufficient value for everyone
- the risks can be controlled during realisation and use.
This requires a proactive approach from the Region and the different cities to foster the regional cooperation, design effective laws, regulations and financial instruments, build and share knowledge among the parties involved. To safeguard public interest, debates are currently raging in the Netherlands concerning heat networks’ ownerships. The government proposes that they should come mainly into public hands.
Watch the recording of the session below!